
File:Population curve.svg

Size of this PNG preview of this SVG file: 547 × 332 pixels. Other resolutions: 320 × 194 pixels | 640 × 388 pixels | 1,024 × 622 pixels | 1,280 × 777 pixels | 2,560 × 1,554 pixels.
Original file (SVG file, nominally 547 × 332 pixels, file size: 10 KB)
| This is a file from the Wikimedia Commons. Information from its description page there is shown below. Commons is a freely licensed media file repository. You can help. |
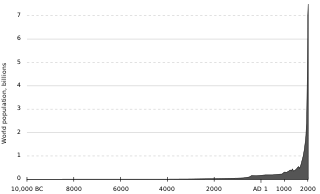
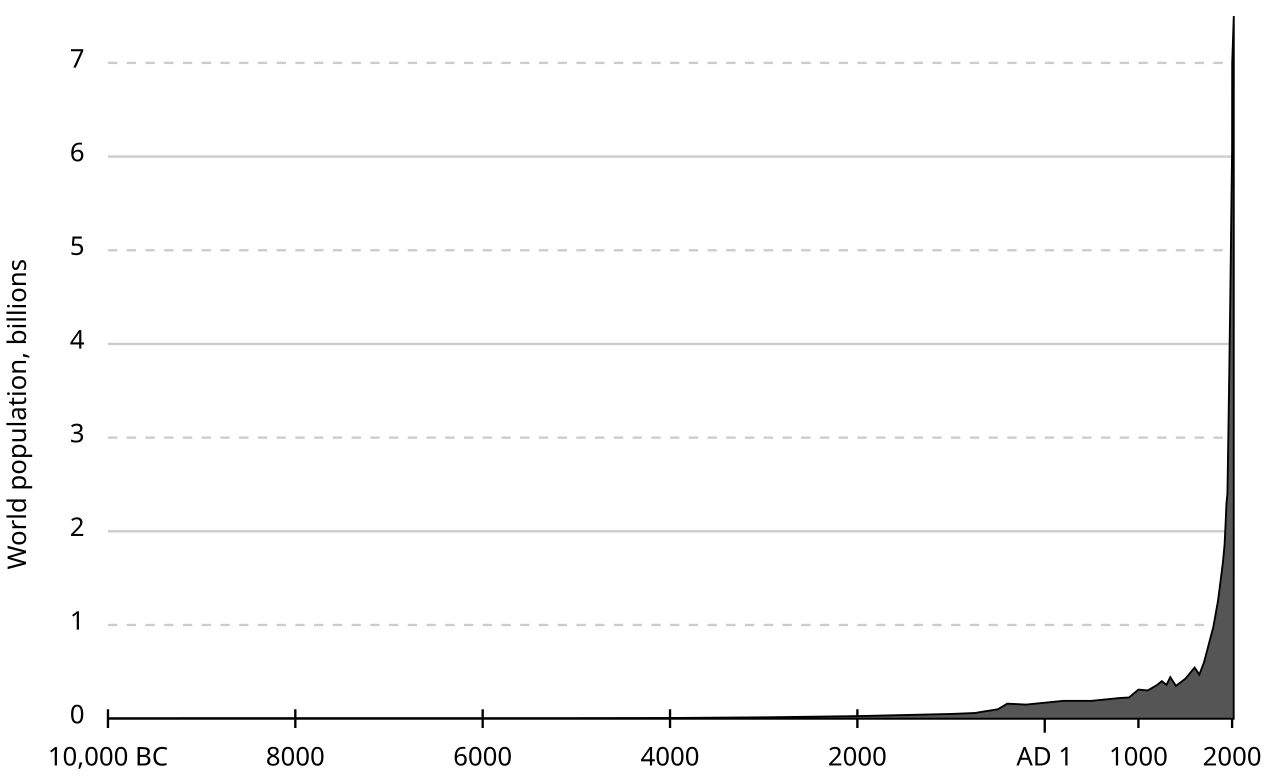
| Description | World human population (est.) 10,000 BC–2000 AD. |
| Source | originally uploaded to en.wikipedia as Population curve.svg. The data is from the "lower" estimates at census.gov (archive.org mirror). |
| Author | El T |
| Other versions | File:Population curve-ar.svg |
| This work has been released into the public domain by its author, El T at English Wikipedia. This applies worldwide. In some countries this may not be legally possible; if so: El T grants anyone the right to use this work for any purpose, without any conditions, unless such conditions are required by law. |
Data
year   world population (millions)
-10000 4
-8000  5
-7000  5
-6000  5
-5000  5
-4000  7
-3000  14
-2000  27
-1000  50
-750   60
-500   100
-400   160
-200   150
1      170
200    190
400    190
500    190
600    200
700    210
800    220
900    226
1000   310
1100   301
1200   360
1250   400
1300   360
1340   443
1400   350
1500   425
1600   545
1650   470
1700   600
1750   790
1800   980
1850   1260
1900   1650
1910   1750
1920   1860
1930   2070
1940   2300
1950   2400
1960   3020
1970   3700
1974   4000
1980   4430
1987   5000
1990   5260
2000   6070
2000   6500 (July 2)*
2000   6747.5 (October 2)*
2001   7000 (March 15)*
2001   7000.025 (April 21)*

*) Data points as actually plotted in 2012-05-24 revision
   (exact X axis values are 2000.5, 2000.75, 2001.2 and 2001.3)
   These are probably incorrect.
Sources
- Biraben, Jean-Noel, 1980, An Essay Concerning Mankind's Evolution, Population, Selected Papers, December, table 2.
- Durand, John D., 1974, "Historical Estimates of World Population: An Evaluation," University of Pennsylvania, Population Center, Analytical and Technical Reports, Number 10, table 2.
- Haub, Carl, 1995, "How Many People Have Ever Lived on Earth?" Population Today, February, p. 5.
- McEvedy, Colin and Richard Jones, 1978, "Atlas of World Population History," Facts on File, New York, pp. 342-351.
- Thomlinson, Ralph, 1975, "Demographic Problems, Controversy Over Population Control," Second Edition, Table 1.
- United Nations (UN), 1973, The Determinants and Consequences ofPopulation Trends, Population Studies, No. 50., p.10.
- United Nations, 1999, The World at Six Billion, Table 1, "World Population From" Year 0 to Stabilization, p. 5, http://www.un.org/esa/population/publications/sixbillion/sixbilpart1.pdf
- U.S. Census Bureau (USCB), 2008, "Total Midyear Population for the World: 1950-2050", Data updated 12-15-2008, https://www.census.gov\/ipc/www/idb/worldpop.html
File history
Click on a date/time to view the file as it appeared at that time.
| Date/Time | Thumbnail | Dimensions | User | Comment | |
|---|---|---|---|---|---|
| current | 22:24, 15 August 2017 | | 547 × 332 (10 KB) | Gregor Hagedorn | Updating to 2017/7.5 billion |
| 09:25, 21 July 2015 |  | 550 × 325 (10 KB) | JorisvS | Reverted to version as of 12:45, 24 May 2012: It breaks the text and numbers in the graph | |
| 18:44, 20 May 2015 |  | 2,500 × 1,478 (15 KB) | GregKaye | moving to bronze age time scale | |
| 12:45, 24 May 2012 |  | 550 × 325 (10 KB) | Spesh531 | Adding up to 7 billion, a year is .004 pixels | |
| 10:56, 10 November 2006 |  | 550 × 275 (4 KB) | Dangauthier |
File usage
The following pages on the English Wikipedia use this file (pages on other projects are not listed):
- Albert Allen Bartlett
- Andrey Korotayev
- Demographic transition
- Doomsday argument
- Environmental degradation
- Estimates of historical world population
- Human impact on the environment
- I = PAT
- Intraspecific competition
- Paul R. Ehrlich
- Population growth
- The Population Bomb
- World population
- Talk:World population/Archive 1
- User:Bigmadrich/sandbox
- User:I worship oil
- User talk:McSly/Archive 1
- Wikipedia:Graphics Lab/Images to improve/Archive/Mar 2008
- Wikipedia:Reference desk/Archives/Humanities/2006 September 4
- Wikipedia:Reference desk/Archives/Miscellaneous/2006 October 2
Global file usage
The following other wikis use this file:
- Usage on af.wikipedia.org
- Usage on ar.wikipedia.org
- Usage on ast.wikipedia.org
- Usage on az.wikipedia.org
- Usage on be.wikipedia.org
- Usage on bg.wikipedia.org
- Usage on bn.wikipedia.org
- Usage on ca.wikipedia.org
- Usage on cs.wikipedia.org
- Usage on cs.wikinews.org
- Usage on da.wikipedia.org
- Usage on da.wikibooks.org
- Usage on de.wikipedia.org
- Usage on el.wikipedia.org
- Usage on en.wikibooks.org
- Usage on en.wiktionary.org
- Usage on eo.wikipedia.org
- Usage on es.wikipedia.org
- Usage on et.wikipedia.org
- Usage on fa.wikipedia.org
- Usage on fi.wikipedia.org
View more global usage of this file.