
File:German tank problem graphs.svg

Size of this PNG preview of this SVG file: 400 × 600 pixels. Other resolutions: 160 × 240 pixels | 320 × 480 pixels | 512 × 768 pixels | 682 × 1,024 pixels | 1,365 × 2,048 pixels.
Original file (SVG file, nominally 512 × 768 pixels, file size: 33 KB)
| This is a file from the Wikimedia Commons. Information from its description page there is shown below. Commons is a freely licensed media file repository. You can help. |
Summary
| Description |
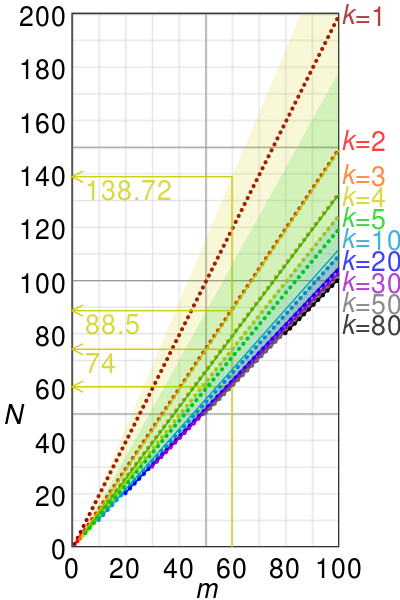
English: Graphs of estimated population size, N for number of samples, k and largest sample serial number, m using frequentist (dotted lines) and Bayesian analysis (solid line shows mean and shading shows range from minimum possible value to mean plus 1 standard deviation) by CMG Lee. The example shows if 4 tanks are observed and the highest serial number is 60, frequentist analysis predicts N = 74 whereas Bayesian analysis predicts a mean of 88.5 and standard deviation of 138.72 - 88.5 = 50.22, and a minimum of 60 tanks. In the SVG file, hover over a graph to highlight it. |
| Source | Own work |
| Author | Cmglee |
Licensing
I, the copyright holder of this work, hereby publish it under the following licenses:
This file is licensed under the Creative Commons Attribution-Share Alike 3.0 Unported license.
- You are free:
- to share – to copy, distribute and transmit the work
- to remix – to adapt the work
- Under the following conditions:
- attribution – You must give appropriate credit, provide a link to the license, and indicate if changes were made. You may do so in any reasonable manner, but not in any way that suggests the licensor endorses you or your use.
- share alike – If you remix, transform, or build upon the material, you must distribute your contributions under the same or compatible license as the original.

|
Permission is granted to copy, distribute and/or modify this document under the terms of the GNU Free Documentation License, Version 1.2 or any later version published by the Free Software Foundation; with no Invariant Sections, no Front-Cover Texts, and no Back-Cover Texts. A copy of the license is included in the section entitled GNU Free Documentation License. |
You may select the license of your choice.
File history
Click on a date/time to view the file as it appeared at that time.
| Date/Time | Thumbnail | Dimensions | User | Comment | |
|---|---|---|---|---|---|
| current | 02:15, 12 March 2016 | | 512 × 768 (33 KB) | Cmglee | {{Information |Description ={{en|1=Graphs of estimated population size, ''N'' for number of samples, ''k'' and largest sample serial number, ''m'' using frequentist (dotted lines) and Bayesian analysis (solid line shows mean and shading shows range... |
File usage
The following pages on the English Wikipedia use this file (pages on other projects are not listed):
Global file usage
The following other wikis use this file:
- Usage on de.wikipedia.org
- Usage on fa.wikipedia.org