
File:Funnel Graph of Estimated Minimum Wage Effects.jpg
No higher resolution available.
Funnel_Graph_of_Estimated_Minimum_Wage_Effects.jpg (650 × 481 pixels, file size: 48 KB, MIME type: image/jpeg)
| This is a file from the Wikimedia Commons. Information from its description page there is shown below. Commons is a freely licensed media file repository. You can help. |
Summary
| Description |
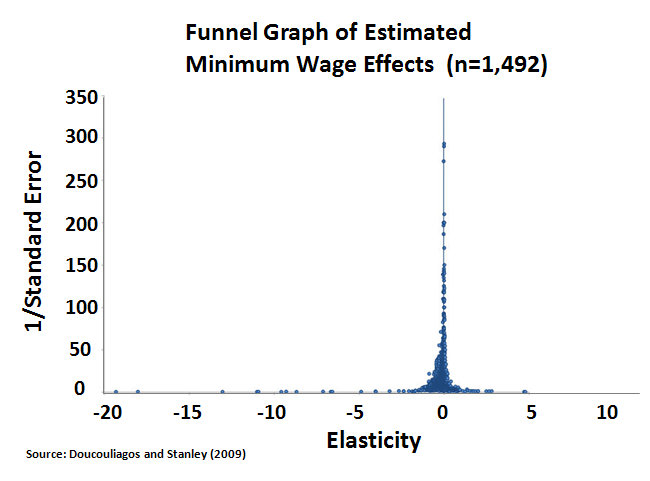
English: Funnel graph of estimated minimum wage effects from a meta-study of 64 minimum wage studies published between 1972 and 2007. Graph shows insignificant employment effect (both practically and statistically) from minimum-wage raises. |
| Date | |
| Source | http://www.cepr.net/documents/publications/min-wage-2013-02.pdf |
| Author | Hristos Doucouliagos and T.D. Stanley |
Original Source: Doucouliagos, H. and Stanley, T. D. (2009), Publication Selection Bias in Minimum-Wage Research? A Meta-Regression Analysis. British Journal of Industrial Relations, 47: 406–428.
Website: http://ideas.repec.org/a/bla/brjirl/v47y2009i2p406-428.html
Licensing
| This work is ineligible for copyright and therefore in the public domain because it consists entirely of information that is common property and contains no original authorship. |
File history
Click on a date/time to view the file as it appeared at that time.
| Date/Time | Thumbnail | Dimensions | User | Comment | |
|---|---|---|---|---|---|
| current | 11:30, 14 March 2013 | | 650 × 481 (48 KB) | Guest2625 | User created page with UploadWizard |
File usage
The following pages on the English Wikipedia use this file (pages on other projects are not listed):
Global file usage
The following other wikis use this file:
- Usage on bs.wikipedia.org
- Usage on lv.wikipedia.org
- Usage on ru.wikipedia.org
- Usage on sl.wikipedia.org