
File:Changes in climate indicators that show global warming.png

Size of this preview: 388 × 599 pixels. Other resolutions: 155 × 240 pixels | 311 × 480 pixels | 497 × 768 pixels | 663 × 1,024 pixels | 2,100 × 3,242 pixels.
Original file (2,100 × 3,242 pixels, file size: 1.39 MB, MIME type: image/png)
| This is a file from the Wikimedia Commons. Information from its description page there is shown below. Commons is a freely licensed media file repository. You can help. |
Summary
| Description |
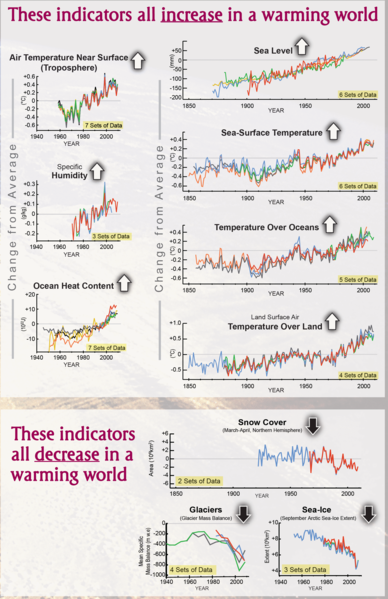
English: This image shows several graphs of climate indicators. The time period covered by each graph varies. The graphs are divided into two groups: (1) indicators that increase if the world is warming, and (2) indicators that decrease if the world is warming. The graphs in the first group are: (a) air temperature near surface (troposphere), (b) specific humidity, (c) ocean heat content, (d) sea level, (e) sea-surface temperature, (f) temperature over the oceans, and (g) temperature over the land. The graphs in the second group are: (a) snow cover (March-April, Northern Hemisphere), (b) glaciers (glacier mass balance), and (c) sea-ice (September Arctic sea-ice extent). From page 2 of the cited public-domain source: "A comprehensive review of key climate indicators confirms the world is warming and the past decade was the warmest on record. More than 300 scientists from 48 countries analyzed data on 37 climate indicators, including sea ice, glaciers and air temperatures. A more detailed review of 10 of these indicators, selected because they are clearly and directly related to surface temperatures, all tell the same story: global warming is undeniable. For example, the surface air temperature record is compiled from weather stations around the world, and analyses of those temperatures from four different institutions show an unmistakable upward trend across the globe. But even without those measurements, nine other major indicators of climate change agree: the earth is growing warmer and has been for more than three decades. A warmer climate means higher sea level, humidity and temperatures in the air and ocean. A warmer climate also means less snow cover, melting Arctic sea ice and shrinking glaciers." |
| Date | |
| Source |
|
| Author | US National Oceanic and Atmospheric Administration: National Climatic Data Center. |
| Permission (Reusing this file) |
"As required by 17 U.S.C. 403, third parties producing copyrighted works consisting predominantly of the material produced by U.S. government agencies must provide notice with such work(s) identifying the U.S. Government material incorporated and stating that such material is not subject to copyright protection within the United States. The information on government web pages is in the public domain and not subject to copyright protection within the United States unless specifically annotated otherwise (copyright may be held elsewhere). Foreign copyrights may apply." http://www.ngdc.noaa.gov/ngdcinfo/privacy.html |
Licensing
This image is in the public domain because it contains materials that originally came from the U.S. National Oceanic and Atmospheric Administration, taken or made as part of an employee's official duties.
|
File history
Click on a date/time to view the file as it appeared at that time.
| Date/Time | Thumbnail | Dimensions | User | Comment | |
|---|---|---|---|---|---|
| current | 05:25, 20 June 2011 | | 2,100 × 3,242 (1.39 MB) | Enescot | {{Information |Description ={{en|1=This image shows several graphs of climate indicators. The time period covered by each graph varies. The graphs are divided into two groups: (1) indicators that increase if the world is warming, and (2) indicators tha |
File usage
The following pages on the English Wikipedia use this file (pages on other projects are not listed):
Global file usage
The following other wikis use this file:
- Usage on ar.wikipedia.org
- Usage on el.wikipedia.org
- Usage on mk.wikipedia.org
- Usage on no.wikipedia.org