
Fault tree analysis

Fault tree analysis (FTA) is a type of failure analysis in which an undesired state of a system is examined. This analysis method is mainly used in safety engineering and reliability engineering to understand how systems can fail, to identify the best ways to reduce risk and to determine (or get a feeling for) event rates of a safety accident or a particular system level (functional) failure. FTA is used in the aerospace,[1] nuclear power, chemical and process,[2][3][4] pharmaceutical,[5] petrochemical and other high-hazard industries; but is also used in fields as diverse as risk factor identification relating to social service system failure.[6] FTA is also used in software engineering for debugging purposes and is closely related to cause-elimination technique used to detect bugs.
In aerospace, the more general term "system failure condition" is used for the "undesired state" / top event of the fault tree. These conditions are classified by the severity of their effects. The most severe conditions require the most extensive fault tree analysis. These system failure conditions and their classification are often previously determined in the functional hazard analysis.
Usage[edit]
Fault tree analysis can be used to:
- understand the logic leading to the top event / undesired state.
- show compliance with the (input) system safety / reliability requirements.
- prioritize the contributors leading to the top event- creating the critical equipment/parts/events lists for different importance measures
- monitor and control the safety performance of the complex system (e.g., is a particular aircraft safe to fly when fuel valve x malfunctions? For how long is it allowed to fly with the valve malfunction?).
- minimize and optimize resources.
- assist in designing a system. The FTA can be used as a design tool that helps to create (output / lower level) requirements.
- function as a diagnostic tool to identify and correct causes of the top event. It can help with the creation of diagnostic manuals / processes.
History[edit]
The examples and perspective in this section may not represent a worldwide view of the subject. (May 2022) |
Fault tree analysis (FTA) was originally developed in 1962 at Bell Laboratories by H.A. Watson, under a U.S. Air Force Ballistics Systems Division contract to evaluate the Minuteman I Intercontinental Ballistic Missile (ICBM) Launch Control System.[7][8][9][10] The use of fault trees has since gained widespread support and is often used as a failure analysis tool by reliability experts.[11] Following the first published use of FTA in the 1962 Minuteman I Launch Control Safety Study, Boeing and AVCO expanded use of FTA to the entire Minuteman II system in 1963–1964. FTA received extensive coverage at a 1965 System Safety Symposium in Seattle sponsored by Boeing and the University of Washington.[12] Boeing began using FTA for civil aircraft design around 1966.[13][14]
Subsequently, within the U.S. military, application of FTA for use with fuses was explored by Picatinny Arsenal in the 1960s and 1970s.[15] In 1976 the U.S. Army Materiel Command incorporated FTA into an Engineering Design Handbook on Design for Reliability.[16] The Reliability Analysis Center at Rome Laboratory and its successor organizations now with the Defense Technical Information Center (Reliability Information Analysis Center, and now Defense Systems Information Analysis Center[17]) has published documents on FTA and reliability block diagrams since the 1960s.[18][19][20] MIL-HDBK-338B provides a more recent reference.[21]
In 1970, the U.S. Federal Aviation Administration (FAA) published a change to 14 CFR 25.1309 airworthiness regulations for transport category aircraft in the Federal Register at 35 FR 5665 (1970-04-08). This change adopted failure probability criteria for aircraft systems and equipment and led to widespread use of FTA in civil aviation. In 1998, the FAA published Order 8040.4,[22] establishing risk management policy including hazard analysis in a range of critical activities beyond aircraft certification, including air traffic control and modernization of the U.S. National Airspace System. This led to the publication of the FAA System Safety Handbook, which describes the use of FTA in various types of formal hazard analysis.[23]
Early in the Apollo program the question was asked about the probability of successfully sending astronauts to the moon and returning them safely to Earth. A risk, or reliability, calculation of some sort was performed and the result was a mission success probability that was unacceptably low. This result discouraged NASA from further quantitative risk or reliability analysis until after the Challenger accident in 1986. Instead, NASA decided to rely on the use of failure modes and effects analysis (FMEA) and other qualitative methods for system safety assessments. After the Challenger accident, the importance of probabilistic risk assessment (PRA) and FTA in systems risk and reliability analysis was realized and its use at NASA has begun to grow and now FTA is considered as one of the most important system reliability and safety analysis techniques.[24]
Within the nuclear power industry, the U.S. Nuclear Regulatory Commission began using PRA methods including FTA in 1975, and significantly expanded PRA research following the 1979 incident at Three Mile Island.[25] This eventually led to the 1981 publication of the NRC Fault Tree Handbook NUREG–0492,[26] and mandatory use of PRA under the NRC's regulatory authority.
Following process industry disasters such as the 1984 Bhopal disaster and 1988 Piper Alpha explosion, in 1992 the United States Department of Labor Occupational Safety and Health Administration (OSHA) published in the Federal Register at 57 FR 6356 (1992-02-24) its Process Safety Management (PSM) standard in 19 CFR 1910.119.[27] OSHA PSM recognizes FTA as an acceptable method for process hazard analysis (PHA).
Today FTA is widely used in system safety and reliability engineering, and in all major fields of engineering.
Methodology[edit]
FTA methodology is described in several industry and government standards, including NRC NUREG–0492 for the nuclear power industry, an aerospace-oriented revision to NUREG–0492 for use by NASA,[24] SAE ARP4761 for civil aerospace, MIL–HDBK–338 for military systems, IEC standard IEC 61025[28] is intended for cross-industry use and has been adopted as European Norm EN 61025.
Any sufficiently complex system is subject to failure as a result of one or more subsystems failing. The likelihood of failure, however, can often be reduced through improved system design. Fault tree analysis maps the relationship between faults, subsystems, and redundant safety design elements by creating a logic diagram of the overall system.
The undesired outcome is taken as the root ('top event') of a tree of logic. For instance, the undesired outcome of a metal stamping press operation being considered might be a human appendage being stamped. Working backward from this top event it might be determined that there are two ways this could happen: during normal operation or during maintenance operation. This condition is a logical OR. Considering the branch of the hazard occurring during normal operation, perhaps it is determined that there are two ways this could happen: the press cycles and harms the operator, or the press cycles and harms another person. This is another logical OR. A design improvement can be made by requiring the operator to press two separate buttons to cycle the machine—this is a safety feature in the form of a logical AND. The button may have an intrinsic failure rate—this becomes a fault stimulus that can be analyzed.
When fault trees are labeled with actual numbers for failure probabilities, computer programs can calculate failure probabilities from fault trees. When a specific event is found to have more than one effect event, i.e. it has impact on several subsystems, it is called a common cause or common mode. Graphically speaking, it means this event will appear at several locations in the tree. Common causes introduce dependency relations between events. The probability computations of a tree which contains some common causes are much more complicated than regular trees where all events are considered as independent. Not all software tools available on the market provide such capability.
The tree is usually written out using conventional logic gate symbols. A cut set is a combination of events, typically component failures, causing the top event. If no event can be removed from a cut set without failing to cause the top event, then it is called a minimal cut set.
Some industries use both fault trees and event trees (see Probabilistic Risk Assessment). An event tree starts from an undesired initiator (loss of critical supply, component failure etc.) and follows possible further system events through to a series of final consequences. As each new event is considered, a new node on the tree is added with a split of probabilities of taking either branch. The probabilities of a range of 'top events' arising from the initial event can then be seen.
Classic programs include the Electric Power Research Institute's (EPRI) CAFTA software, which is used by many of the US nuclear power plants and by a majority of US and international aerospace manufacturers, and the Idaho National Laboratory's SAPHIRE, which is used by the U.S. Government to evaluate the safety and reliability of nuclear reactors, the Space Shuttle, and the International Space Station. Outside the US, the software RiskSpectrum is a popular tool for fault tree and event tree analysis, and is licensed for use at more than 60% of the world's nuclear power plants for probabilistic safety assessment. Professional-grade free software is also widely available; SCRAM[29] is an open-source tool that implements the Open-PSA Model Exchange Format[30] open standard for probabilistic safety assessment applications.
Graphic symbols[edit]
The basic symbols used in FTA are grouped as events, gates, and transfer symbols. Minor variations may be used in FTA software.
Event symbols[edit]
Event symbols are used for primary events and intermediate events. Primary events are not further developed on the fault tree. Intermediate events are found at the output of a gate. The event symbols are shown below:
-
 Basic event
 -
 External event
 -
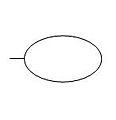
 Undeveloped event
 -
 Conditioning event
 -
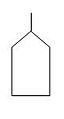
 Intermediate event


The primary event symbols are typically used as follows:
- Basic event – failure or error in a system component or element (example: switch stuck in open position)
- External event – normally expected to occur (not of itself a fault)
- Undeveloped event – an event about which insufficient information is available, or which is of no consequence
- Conditioning event – conditions that restrict or affect logic gates (example: mode of operation in effect)
An intermediate event gate can be used immediately above a primary event to provide more room to type the event description.
FTA is a top-to-bottom approach.
Gate symbols[edit]
Gate symbols describe the relationship between input and output events. The symbols are derived from Boolean logic symbols:
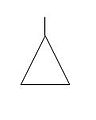
-
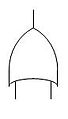 OR gate
 -
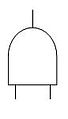 AND gate
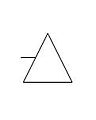
 -
 Exclusive OR gate
 -
 Priority AND gate
 -
 Inhibit gate


The gates work as follows:
- OR gate – the output occurs if any input occurs.
- AND gate – the output occurs only if all inputs occur (inputs are independent from the source).
- Exclusive OR gate – the output occurs if exactly one input occurs.
- Priority AND gate – the output occurs if the inputs occur in a specific sequence specified by a conditioning event.
- Inhibit gate – the output occurs if the input occurs under an enabling condition specified by a conditioning event.
Transfer symbols[edit]
Transfer symbols are used to connect the inputs and outputs of related fault trees, such as the fault tree of a subsystem to its system. NASA prepared a complete document about FTA through practical incidents.[24]
-
 Transfer in
 -
 Transfer out


Basic mathematical foundation[edit]
Events in a fault tree are associated with statistical probabilities or Poisson-Exponentially distributed constant rates. For example, component failures may typically occur at some constant failure rate λ (a constant hazard function). In this simplest case, failure probability depends on the rate λ and the exposure time t:

where:
if


A fault tree is often normalized to a given time interval, such as a flight hour or an average mission time. Event probabilities depend on the relationship of the event hazard function to this interval.
Unlike conventional logic gate diagrams in which inputs and outputs hold the binary values of TRUE (1) or FALSE (0), the gates in a fault tree output probabilities related to the set operations of Boolean logic. The probability of a gate's output event depends on the input event probabilities.
An AND gate represents a combination of independent events. That is, the probability of any input event to an AND gate is unaffected by any other input event to the same gate. In set theoretic terms, this is equivalent to the intersection of the input event sets, and the probability of the AND gate output is given by:
- P (A and B) = P (A ∩ B) = P(A) P(B)
An OR gate, on the other hand, corresponds to set union:
- P (A or B) = P (A ∪ B) = P(A) + P(B) - P (A ∩ B)
Since failure probabilities on fault trees tend to be small (less than .01), P (A ∩ B) usually becomes a very small error term, and the output of an OR gate may be conservatively approximated by using an assumption that the inputs are mutually exclusive events:
- P (A or B) ≈ P(A) + P(B), P (A ∩ B) ≈ 0
An exclusive OR gate with two inputs represents the probability that one or the other input, but not both, occurs:
- P (A xor B) = P(A) + P(B) - 2P (A ∩ B)
Again, since P (A ∩ B) usually becomes a very small error term, the exclusive OR gate has limited value in a fault tree.
Quite often, Poisson-Exponentially distributed rates[31] are used to quantify a fault tree instead of probabilities. Rates are often modeled as constant in time while probability is a function of time. Poisson-Exponential events are modelled as infinitely short so no two events can overlap. An OR gate is the superposition (addition of rates) of the two input failure frequencies or failure rates which are modeled as Poisson point processes. The output of an AND gate is calculated using the unavailability (Q1) of one event thinning the Poisson point process of the other event (λ2). The unavailability (Q2) of the other event then thins the Poisson point process of the first event (λ1). The two resulting Poisson point processes are superimposed according to the following equations.
The output of an AND gate is the combination of independent input events 1 and 2 to the AND gate:
- Failure Frequency = λ1Q2 + λ2Q1 where Q = 1 - eλt ≈ λt if λt < 0.001
- Failure Frequency ≈ λ1λ2t2 + λ2λ1t1 if λ1t1 < 0.001 and λ2t2 < 0.001
In a fault tree, unavailability (Q) may be defined as the unavailability of safe operation and may not refer to the unavailability of the system operation depending on how the fault tree was structured. The input terms to the fault tree must be carefully defined.
Analysis[edit]
Many different approaches can be used to model a FTA, but the most common and popular way can be summarized in a few steps. A single fault tree is used to analyze one and only one undesired event, which may be subsequently fed into another fault tree as a basic event. Though the nature of the undesired event may vary dramatically, a FTA follows the same procedure for any undesired event; be it a delay of 0.25 ms for the generation of electrical power, an undetected cargo bay fire, or the random, unintended launch of an ICBM.
FTA analysis involves five steps:
- Define the undesired event to study.
- Definition of the undesired event can be very hard to uncover, although some of the events are very easy and obvious to observe. An engineer with a wide knowledge of the design of the system is the best person to help define and number the undesired events. Undesired events are used then to make FTAs. Each FTA is limited to one undesired event.
- Obtain an understanding of the system.
- Once the undesired event is selected, all causes with probabilities of affecting the undesired event of 0 or more are studied and analyzed. Getting exact numbers for the probabilities leading to the event is usually impossible for the reason that it may be very costly and time-consuming to do so. Computer software is used to study probabilities; this may lead to less costly system analysis.
System analysts can help with understanding the overall system. System designers have full knowledge of the system and this knowledge is very important for not missing any cause affecting the undesired event. For the selected event all causes are then numbered and sequenced in the order of occurrence and then are used for the next step which is drawing or constructing the fault tree.
- Once the undesired event is selected, all causes with probabilities of affecting the undesired event of 0 or more are studied and analyzed. Getting exact numbers for the probabilities leading to the event is usually impossible for the reason that it may be very costly and time-consuming to do so. Computer software is used to study probabilities; this may lead to less costly system analysis.
- Construct the fault tree.
- After selecting the undesired event and having analyzed the system so that we know all the causing effects (and if possible their probabilities) we can now construct the fault tree. Fault tree is based on AND and OR gates which define the major characteristics of the fault tree.
- Evaluate the fault tree.
- After the fault tree has been assembled for a specific undesired event, it is evaluated and analyzed for any possible improvement or in other words study the risk management and find ways for system improvement. A wide range of qualitative and quantitative analysis methods can be applied.[32] This step is as an introduction for the final step which will be to control the hazards identified. In short, in this step we identify all possible hazards affecting the system in a direct or indirect way.
- Control the hazards identified.
- This step is very specific and differs largely from one system to another, but the main point will always be that after identifying the hazards all possible methods are pursued to decrease the probability of occurrence.
Comparison with other analytical methods[edit]
FTA is a deductive, top-down method aimed at analyzing the effects of initiating faults and events on a complex system. This contrasts with failure mode and effects analysis (FMEA), which is an inductive, bottom-up analysis method aimed at analyzing the effects of single component or function failures on equipment or subsystems. FTA is very good at showing how resistant a system is to single or multiple initiating faults. It is not good at finding all possible initiating faults. FMEA is good at exhaustively cataloging initiating faults, and identifying their local effects. It is not good at examining multiple failures or their effects at a system level. FTA considers external events, FMEA does not.[33] In civil aerospace the usual practice is to perform both FTA and FMEA, with a failure mode effects summary (FMES) as the interface between FMEA and FTA.
Alternatives to FTA include dependence diagram (DD), also known as reliability block diagram (RBD) and Markov analysis. A dependence diagram is equivalent to a success tree analysis (STA), the logical inverse of an FTA, and depicts the system using paths instead of gates. DD and STA produce probability of success (i.e., avoiding a top event) rather than probability of a top event.
See also[edit]
- Event tree analysis
- Failure mode and effects analysis
- Ishikawa diagram
- Reliability engineering
- Root cause analysis
- Safety engineering
- System safety
- Why-because analysis
References[edit]
- ^ Goldberg, B. E.; Everhart, K.; Stevens, R.; Babbitt, N.; Clemens, P.; Stout, L. (1994). "3". System engineering toolbox for design-oriented engineers. Marshall Space Flight Center. pp. 3–35 to 3–48.
{{cite book}}: CS1 maint: location missing publisher (link) - ^ Center for Chemical Process Safety (April 2008). Guidelines for Hazard Evaluation Procedures (3rd ed.). Wiley. ISBN 978-0-471-97815-2.
- ^ Center for Chemical Process Safety (October 1999). Guidelines for Chemical Process Quantitative Risk Analysis (2nd ed.). American Institute of Chemical Engineers. ISBN 978-0-8169-0720-5.
- ^ U.S. Department of Labor Occupational Safety and Health Administration (1994). Process Safety Management Guidelines for Compliance (PDF). U.S. Government Printing Office. OSHA 3133.
- ^ ICH Harmonised Tripartite Guidelines. Quality Guidelines (January 2006). Q9 Quality Risk Management.
- ^ Lacey, Peter (2011). "An Application of Fault Tree Analysis to the Identification and Management of Risks in Government Funded Human Service Delivery". Proceedings of the 2nd International Conference on Public Policy and Social Sciences. SSRN 2171117.
- ^ Ericson, Clifton (1999). "Fault Tree Analysis - A History" (PDF). Proceedings of the 17th International Systems Safety Conference. Archived from the original (PDF) on 2011-07-23. Retrieved 2010-01-17.
- ^ Rechard, Robert P. (1999). "Historical Relationship Between Performance Assessment for Radioactive Waste Disposal and Other Types of Risk Assessment in the United States" (pdf). Risk Analysis. 19 (5): 763–807. doi:10.1023/A:1007058325258. PMID 10765434. S2CID 704496. SAND99-1147J. Retrieved 2010-01-22.
- ^ Winter, Mathias (1995). "Software Fault Tree Analysis of an Automated Control System Device Written in ADA". Master's Thesis. ADA303377. Archived from the original (pdf) on May 15, 2012. Retrieved 2010-01-17.
- ^ Benner, Ludwig (1975). "Accident Theory and Accident Investigation". Proceedings of the Society of Air Safety Investigators Annual Seminar. Retrieved 2010-01-17.
- ^ Martensen, Anna L.; Butler, Ricky W. (January 1987). "The Fault-Tree Compiler". Langely Research Center. NTRS. Retrieved June 17, 2011.
- ^ DeLong, Thomas (1970). "A Fault Tree Manual". Master's Thesis. AD739001. Archived from the original (pdf) on March 4, 2016. Retrieved 2014-05-18.
- ^ Eckberg, C. R. (1964). WS-133B Fault Tree Analysis Program Plan. Seattle, WA: The Boeing Company. D2-30207-1. Archived from the original on March 3, 2016. Retrieved 2014-05-18.
- ^ Hixenbaugh, A. F. (1968). Fault Tree for Safety. Seattle, WA: The Boeing Company. D6-53604. Archived from the original on March 3, 2016. Retrieved 2014-05-18.
- ^ Larsen, Waldemar (January 1974). Fault Tree Analysis. Picatinny Arsenal. Technical Report 4556. Archived from the original on May 18, 2014. Retrieved 2014-05-17.
- ^ Evans, Ralph A. (January 5, 1976). Engineering Design Handbook Design for Reliability (PDF). US Army Materiel Command. AMCP-706-196. Archived (PDF) from the original on May 18, 2014. Retrieved 2014-05-17.
- ^ "DSIAC – Defense Systems Information Analysis Center". Retrieved 2023-03-25.
- ^ Begley, T. F.; Cummings (1968). Fault Tree for Safety. RAC. ADD874448.
- ^ Anderson, R. T. (March 1976). Reliability Design Handbook (PDF). Reliability Analysis Center. RDH 376. Archived from the original on May 18, 2014. Retrieved 2014-05-17.
- ^ Mahar, David J.; James W. Wilbur (1990). Fault Tree Analysis Application Guide. Reliability Analysis Center.
- ^ "7.9 Fault Tree Analysis". Electronic Reliability Design Handbook (pdf). B. U.S. Department of Defense. 1998. MIL–HDBK–338B. Retrieved 2010-01-17.
- ^ ASY-300 (June 26, 1998). Safety Risk Management (PDF). Federal Aviation Administration. 8040.4.
{{cite book}}: CS1 maint: numeric names: authors list (link) - ^ FAA (December 30, 2000). System Safety Handbook. Federal Aviation Administration.
- ^ a b c Vesely, William; et al. (2002). Fault Tree Handbook with Aerospace Applications (PDF). National Aeronautics and Space Administration. Archived from the original (PDF) on 2016-12-28. Retrieved 2018-07-16.
 This article incorporates text from this source, which is in the public domain.
- ^ Acharya, Sarbes; et al. (1990). Severe Accident Risks: An Assessment for Five U.S. Nuclear Power Plants (PDF). Wasthington, DC: U.S. Nuclear Regulatory Commission. NUREG–1150. Retrieved 2010-01-17.
- ^ Vesely, W. E.; et al. (1981). Fault Tree Handbook (PDF). Nuclear Regulatory Commission. NUREG–0492. Retrieved 2010-01-17.
- ^ Elke, Holly C., Global Application of the Process Safety Management Standard (PDF)
- ^ Fault Tree Analysis. Edition 2.0. International Electrotechnical Commission. 2006. ISBN 978-2-8318-8918-4. IEC 61025.
- ^ "SCRAM 0.11.4 — SCRAM 0.11.4 documentation". scram-pra.org. Archived from the original on 23 November 2016. Retrieved 13 January 2022.
- ^ "The Open-PSA Model Exchange Format — The Open-PSA Model Exchange Format 2.0". open-psa.github.io.
- ^ Olofsson and Andersson, Probability, Statistics and Stochastic Processes, John Wiley and Sons, 2011.
- ^ Ruijters, Enno; Stoelinga, Mariëlle I. A. (February–May 2015). "Fault tree analysis: A survey of the state-of-the-art in modeling, analysis and tools". Computer Science Review. 15–16: 29–62. doi:10.1016/j.cosrev.2015.03.001.
- ^ Long, Allen, Beauty & the Beast – Use and Abuse of Fault Tree as a Tool (PDF), fault-tree.net, archived from the original (PDF) on 19 April 2009, retrieved 16 January 2010