From Wikipedia, the free encyclopedia
U.S. House district for California
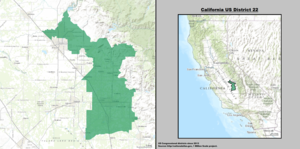
California's 22nd congressional district Interactive map of district boundaries since 2023 (Used in the
2022 elections )
Representative Population (2022) 775,019 Median household $54,697[1] Ethnicity Cook PVI D+5[2]
California's 22nd congressional district is a congressional district in the U.S. state of California . It is represented by David Valadao , who formerly represented California's 21st congressional district from 2013 to 2019 and 2021 to 2023. As of 2024, this district, alongside New York's 4th , is the most Democratic-leaning congressional district represented by a Republican, with a partisan lean of D+5.[2] Joe Biden in the 2020 presidential election had they existed in their current configuration while being won or held by a Republican in 2022 .
Following redistricting in 2021, the district is still in the San Joaquin Valley. It includes most of Kings County and parts of Tulare and Kern Counties . It includes the east side of Bakersfield ; the west and south sides of Tulare , the south side of Hanford ; and all of Porterville , Lindsay , Shafter , Wasco , Delano , McFarland , Arvin , Lamont , and Corcoran .[3]
Recent election results from statewide races [ edit ] Composition [ edit ] Cities with 10,000 or more people [ edit ] Bakersfield - 403,455Tulare - 68,875Porterville - 62,623Hanford - 57,703Delano - 51,428Oildale - 32,684Wasco - 28,710East Niles - 28,390Corcoran - 22,339Shafter - 20,401Arvin - 19,495Greenfield - 18,937McFarland - 15,506Lamont - 15,120Avenal - 13,696Lindsay - 12,659Hillcrest - 10,5282,500-10,000 people [ edit ] Earlimart - 7,697Fairfax - 7,605East Porterville - 7,331Cottonwood - 6,268Benton Park - 5,333Armona - 4,294Old Stine - 3,841Rexland Acres - 3,563Pixley - 3,310Strathmore - 3,033Terra Bella - 2,910Weedpatch - 2,658Tipton - 2,543Richgrove - 2,538List of members representing the district [ edit ]
Member
Party
Dates
Cong
Electoral history
District location (counties)
District created January 3, 1943
John J. Phillips (Banning )
Republican
January 3, 1943 –
78th 79th 80th 81st 82nd
Elected in 1942 .Re-elected in 1944 .Re-elected in 1946 .Re-elected in 1948 .Re-elected in 1950 .29th district 1943–1953 Imperial , Orange , Riverside
Joseph F. Holt (Los Angeles )
Republican
January 3, 1953 –
83rd 84th 85th 86th
Elected in 1952 .Re-elected in 1954 .Re-elected in 1956 .Re-elected in 1958 .1953–1983 Los Angeles
James C. Corman (Los Angeles )
Democratic
January 3, 1961 –
87th 88th 89th 90th 91st 92nd 93rd
Elected in 1960 .Re-elected in 1962 .Re-elected in 1964 .Re-elected in 1966 .Re-elected in 1968 .Re-elected in 1970 .Re-elected in 1972 .21st district
Carlos J. Moorhead (Glendale )
Republican
January 3, 1975 –
94th 95th 96th 97th 98th 99th 100th 101st 102nd
Redistricted from the 20th district re-elected in 1974 .Re-elected in 1976 .Re-elected in 1978 .Re-elected in 1980 .Re-elected in 1982 .Re-elected in 1984 .Re-elected in 1986 .Re-elected in 1988 .Re-elected in 1990 .27th district
1983–1993 Los Angeles (northern L.A. suburbs)
Michael Huffington (Santa Barbara )
Republican
January 3, 1993 –
103rd
Elected in 1992 .run for U.S. senator .
1993–2003 San Luis Obispo , Santa Barbara
Andrea Seastrand (Pismo Beach )
Republican
January 3, 1995 –
104th
Elected in 1994 .
Walter Capps (Santa Barbara )
Democratic
January 3, 1997 –
105th
Elected in 1996 .
Vacant
October 28, 1997 –
Lois Capps (Santa Barbara )
Democratic
March 17, 1998 –
105th 106th 107th
Elected to finish her husband's term .Re-elected later in 1998 .Re-elected in 2000 .23rd district
Bill Thomas (Bakersfield )
Republican
January 3, 2003 –
108th 109th
Redistricted from the 21st district re-elected in 2002 .Re-elected in 2004 .
2003–2013 Kern , Los Angeles (Lancaster ), inland San Luis Obispo
Kevin McCarthy (Bakersfield )
Republican
January 3, 2007 –
110th 111th 112th
Elected in 2006 .Re-elected in 2008 .Re-elected in 2010 .23rd district
Devin Nunes (Tulare )
Republican
January 3, 2013 –
113th 114th 115th 116th 117th
Redistricted from the 21st district re-elected in 2012 .Re-elected in 2014 .Re-elected in 2016 .Re-elected in 2018 .Re-elected in 2020 .Trump Media & Technology Group .
2013–2023 Fresno , Tulare Fresno , Clovis , Tulare , Visalia )
Vacant
January 1, 2022 –
117th
Connie Conway (Tulare )
Republican
June 14, 2022 –
Elected to finish Nunes' term .20th district
David Valadao (Hanford )
Republican
January 3, 2023 –
118th
Redistricted from the 21st district re-elected in 2022 .
2023–present Kings , Tulare , and Kern
Election results [ edit ] 1998 (special) [ edit ] 2022 (special) [ edit ] Historical district boundaries [ edit ] 2003–2013
2013 – 2023
See also [ edit ]
References [ edit ]
^ Center for New Media & Promotion (CNMP), US Census Bureau. "My Congressional District" . www.census.gov . ^ a b "2022 Cook PV: District Map and List" . The Cook Political Report. July 12, 2022. Retrieved January 5, 2023 .^ "CA 2022 Congressional" . Dave's Redistricting . January 4, 2022. Retrieved November 11, 2022 .^ "Statement of Vote (2000 U.S. President)" (PDF) . Archived from the original (PDF) on June 11, 2007. Retrieved September 17, 2008 .^ "Statement of Vote (2000 U.S. Senator)" (PDF) . Archived from the original (PDF) on June 11, 2007. Retrieved September 17, 2008 .^ "Statement of Vote (2002 Governor)" (PDF) . Archived from the original (PDF) on November 11, 2010.^ "Statement of Vote (2003 Recall Question)" (PDF) . Archived from the original (PDF) on May 20, 2011. Retrieved October 8, 2007 .^ "Statement of Vote (2003 Governor)" (PDF) . Archived from the original (PDF) on May 20, 2011. Retrieved October 8, 2007 .^ "Statement of Vote (2004 U.S. President)" (PDF) . Archived from the original (PDF) on August 1, 2010. Retrieved August 8, 2007 .^ "Statement of Vote (2004 U.S. Senator)" (PDF) . Archived from the original (PDF) on August 10, 2011.^ "Statement of Vote (2006 U.S. Senator)" (PDF) . Archived from the original (PDF) on August 10, 2011.^ "Statement of Vote (2006 Governor)" (PDF) . Archived from the original (PDF) on August 10, 2011.^ "(2008 U.S. President)" . Archived from the original on May 17, 2009. Retrieved March 5, 2009 .^ "Counties by Congressional District for Recall Question" (PDF) . sos.ca.gov . September 14, 2021. Retrieved May 2, 2022 .^ "Counties by Congressional Districts for Governor" (PDF) . sos.ca.gov . November 8, 2022. Retrieved May 4, 2023 .^ "1942 election results" (PDF) .^ "1944 election results" (PDF) .^ "1946 election results" (PDF) .^ "1948 election results" (PDF) .^ "1950 election results" (PDF) .^ "1952 election results" (PDF) .^ "1954 election results" (PDF) .^ "1956 election results" (PDF) .^ "1958 election results" (PDF) .^ "1960 election results" (PDF) .^ "1962 election results" (PDF) .^ "1964 election results" (PDF) .^ "1966 election results" (PDF) .^ "1968 election results" (PDF) .^ "1970 election results" (PDF) .^ "1972 election results" (PDF) .^ "1974 election results" (PDF) .^ "1976 election results" (PDF) .^ "1978 election results" (PDF) .^ "1980 election results" (PDF) .^ "1982 election results" (PDF) .^ "1984 election results" (PDF) .^ "1986 election results" (PDF) .^ "1988 election results" (PDF) .^ "1990 election results" (PDF) .^ "1992 election results" (PDF) .^ "1994 election results" (PDF) .^ "1996 election results" (PDF) .^ "JoinCalifornia - 03-10-1998 Election" . www.joincalifornia.com .^ "1998 election results" (PDF) .^ "2000 election results" (PDF) .^ "2002 general election results" (PDF) . Archived from the original (PDF) on February 3, 2009.^ "2004 general election results" (PDF) . Archived from the original (PDF) on August 21, 2008.^ "2006 general election results" (PDF) . Archived from the original (PDF) on November 27, 2008.^ "2008 general election results" (PDF) . Archived from the original (PDF) on December 21, 2008.^ "2010 general election results" (PDF) . Archived from the original (PDF) on May 20, 2011. Retrieved February 11, 2011 .^ "2012 general election results" (PDF) . Archived from the original (PDF) on October 19, 2013.^ "U.S. House of Representatives District 22 - Districtwide Results" . Archived from the original on January 6, 2015. Retrieved December 21, 2014 .
External links [ edit ]
The at-large seats only existed from 1850 to 1865 and from 1883 to 1885. See also
California's past and present representatives , senators , and delegations
35°12′N 119°54′W / 35.2°N 119.9°W / 35.2; -119.9

.svg)


.jpg)


_(new_version).svg)


.jpg)